Dynamic Report [Edcite Schools Feature]
Follow these step by step instruction to access the Dynamic Report.
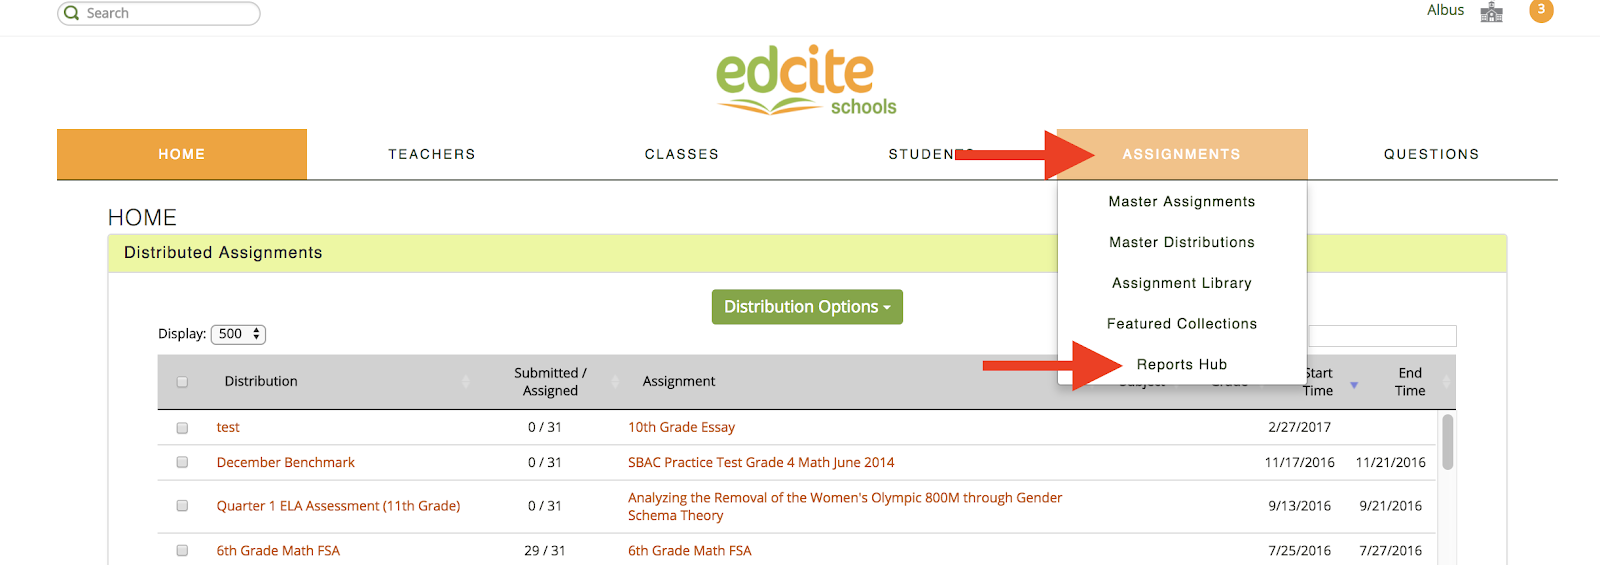
1. From the top navigation bar in your admin account, select Assignments and then click Reports Hub.
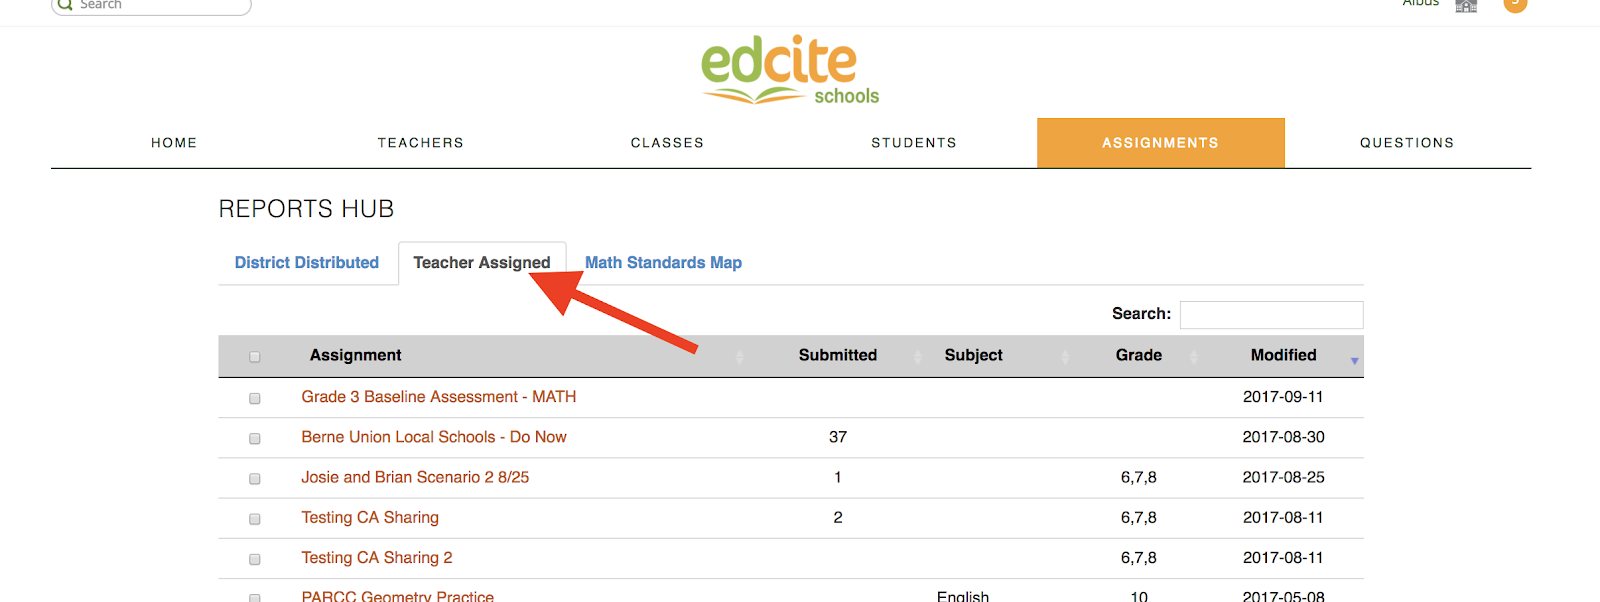
2. Select the Teacher Assigned tab.
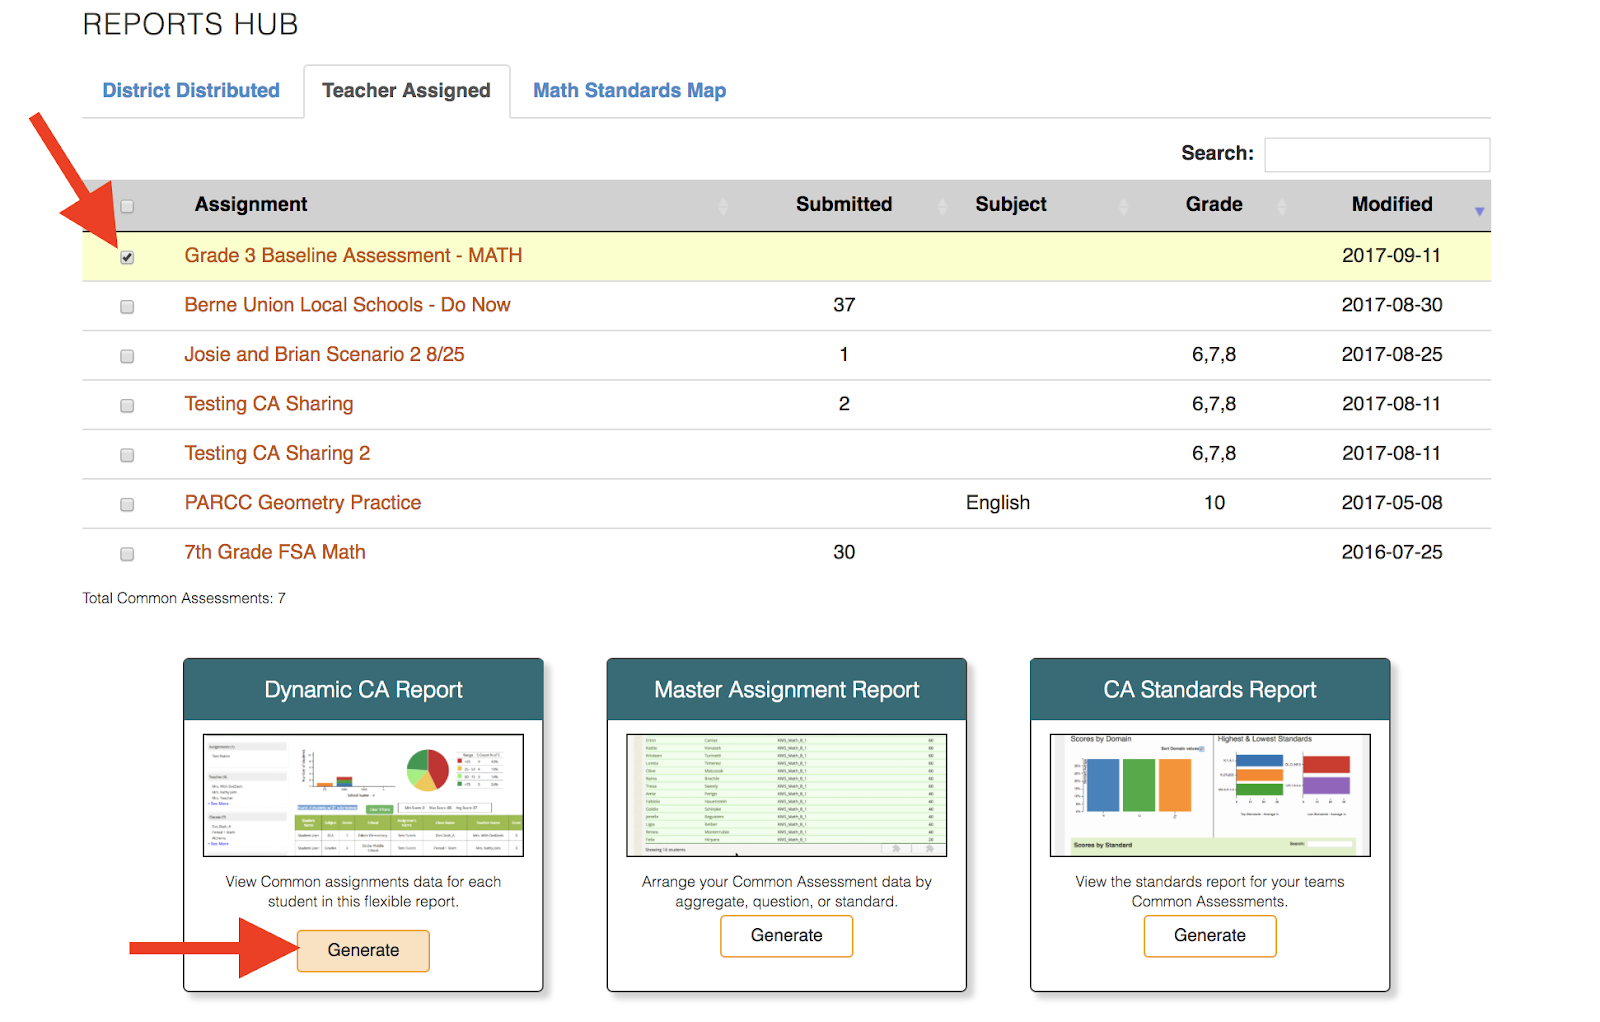
3. Select the Common Assessment(s) you want to view the report for by checking the box next to the name.
4. Click the Generate button on Dynamic Report.
5. Now you can analyze the report. The left hand side features all of the filters to view subsets of data. You can filter by assignment, teachers, classes, schools, subjects, grades, and score.
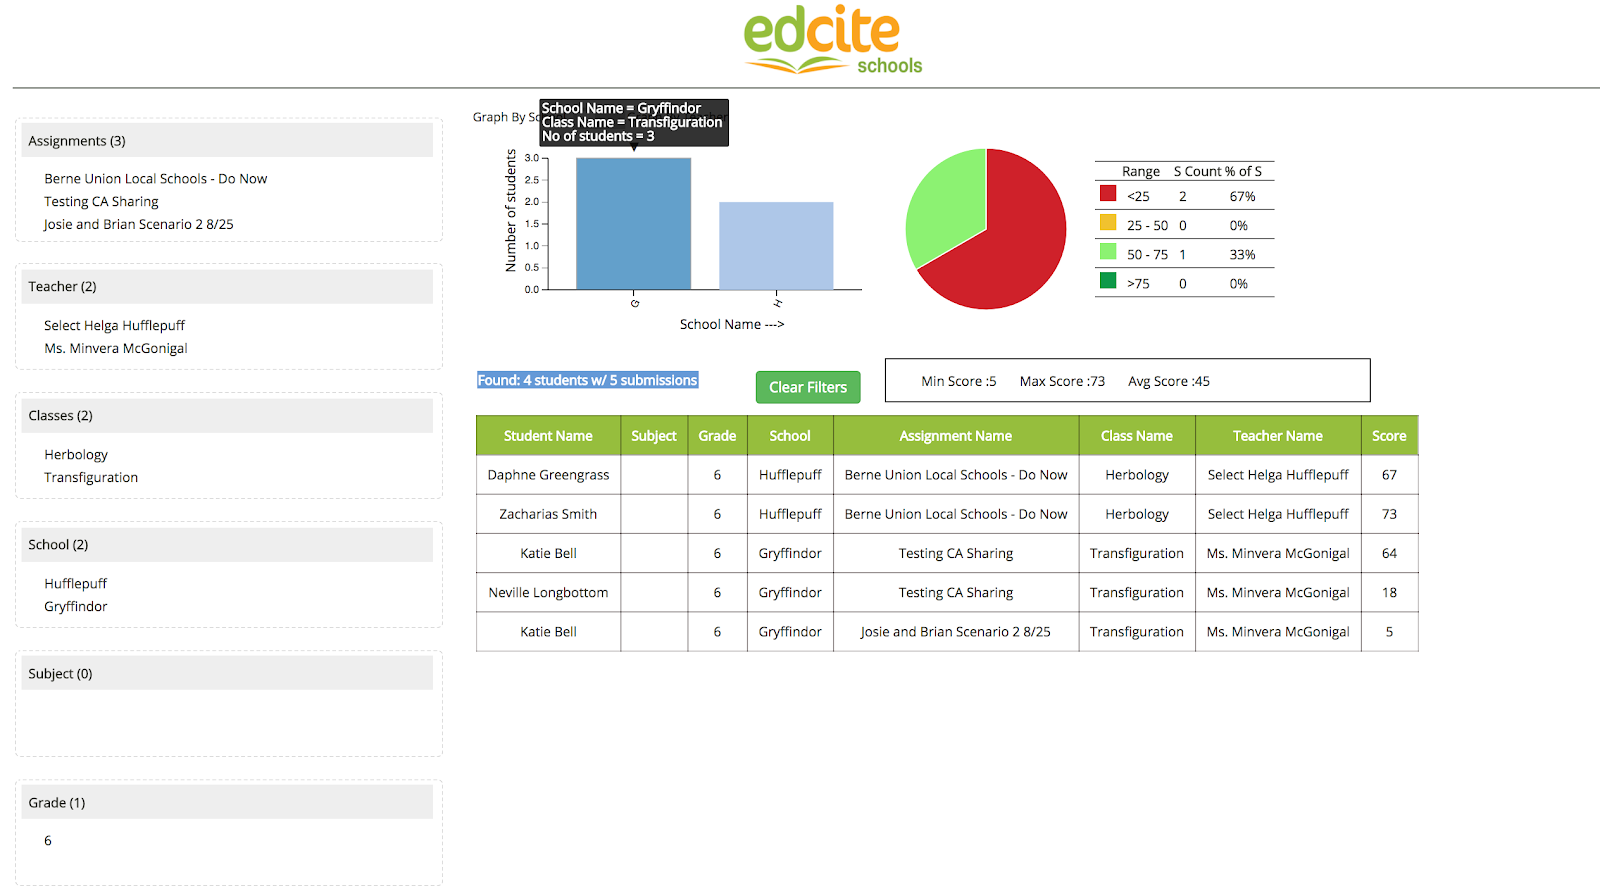
6. To use a filter, click on the name that you want to select. Your selection will highlight in green. The table and graphs will update to reflect your selections. Click the Clear Filters button to clear your selections.
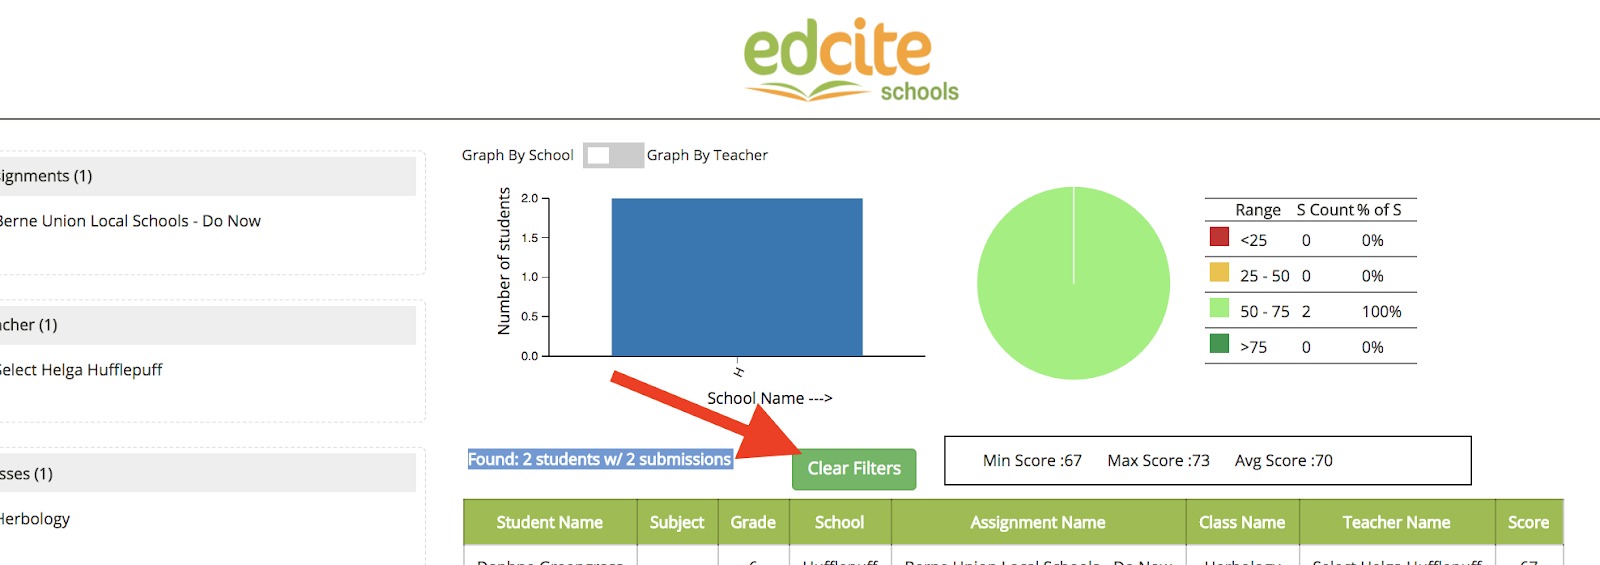
7. Hover over the pie chart to see more information and the graph will update. You can view the range (percentage score range for a student in quartiles), the student count (number of stuents in that range), and the percentage of students who scored in that range. You can also change from school to teacher to alter what the graph represents.
For more help on this or any other topics, please contact hello@edcite.com.
Click the following link to access the Google Document for this solution:
https://docs.google.com/document/d/1_XqE-jc-Brm__JGrK0dtk5KgmBQ3d90boo4Tv6A88rM/edit?usp=sharing
ENG09-14
Updated 29 Sept 2017
Related Articles
Dynamic Report [Edcite Schools Feature]
This feature is available as part of our premium platform, Edcite Schools. To learn more about Edcite Schools, click here. Dynamic Report Description Allows teachers to view Common Assessment data for each student in a flexible report. Example ...Admin Standards CSV Report [Edcite Schools Feature]
This feature is available as part of our premium platform, Edcite Schools. To learn more about Edcite Schools, click here. Follow these step by step instructions to check teacher activity from your admin account. 1. In your admin account, on the top ...Teacher Assigned Common Assessment Standards Report [Edcite Schools Feature]
This feature is available as part of our premium platform, Edcite Schools. To learn more about Edcite Schools, click here. The Teacher Assigned Common Assessment Standards Report is used for examining data based on standards. Only one assignment can ...District Distributed Common Assessment Standards Report [Edcite Schools Feature]
This feature is available as part of our premium platform, Edcite Schools. To learn more about Edcite Schools, click here. The District Distributed Common Assessment Standards Report is used for examining data based on standards. Only one assignment ...Admin/Sub Admin - How to Access Common Assessment Reports [Edcite Schools Feature]
This feature is available as part of our premium platform, Edcite Schools. To learn more about Edcite Schools, click here. Follow these step by step instructions to access Common Assessment data from an Admin or Sub Admin account. 1. To access Common ...