Question Type - Select Bar Graph
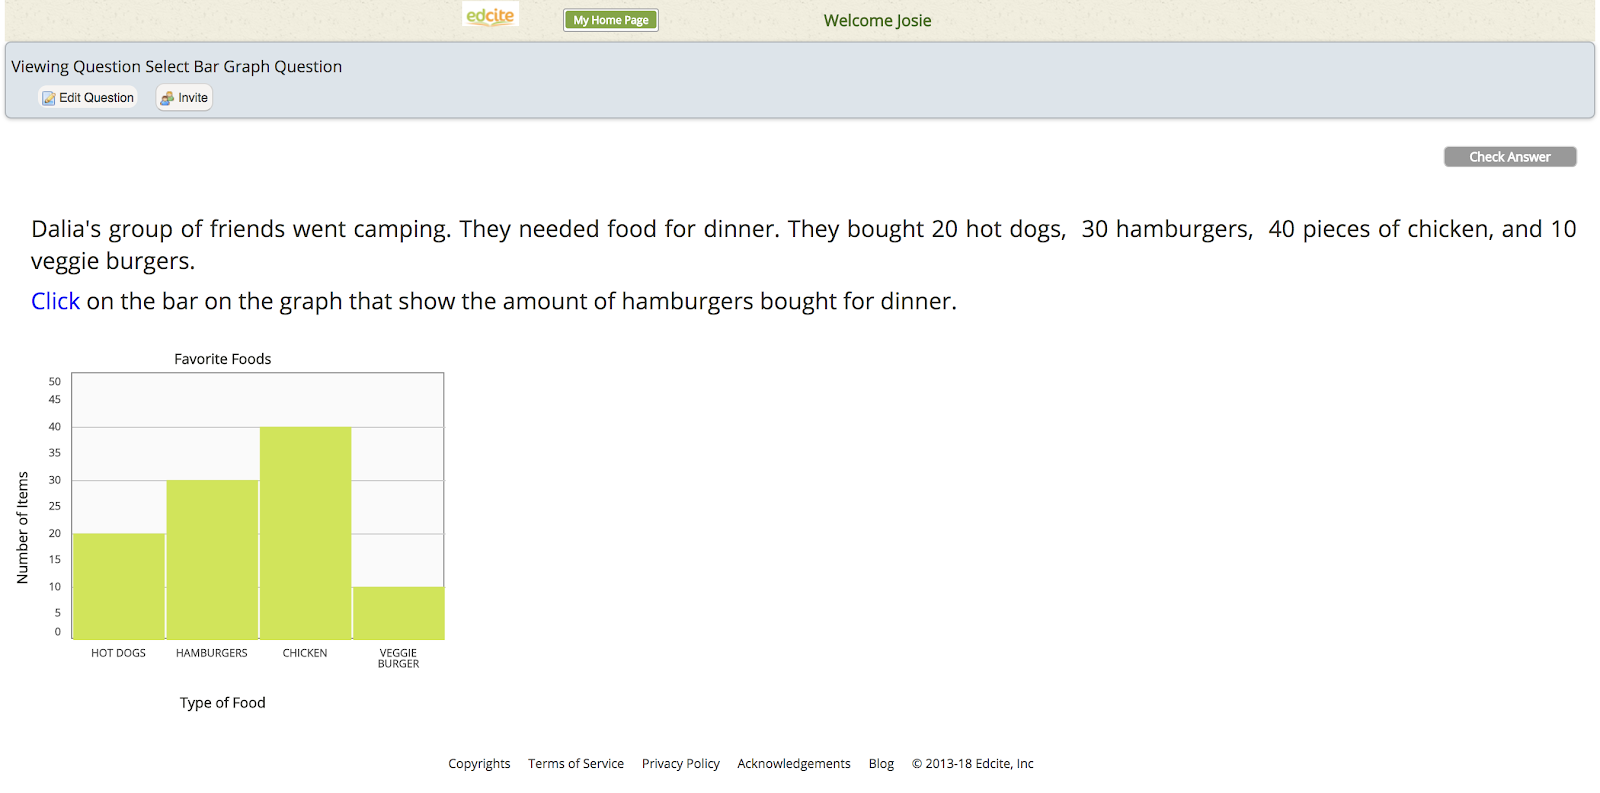
Description | Student will select bars in the graph to signify a point of data. Students can choose one bar or several bars within the graph. |
Example | |
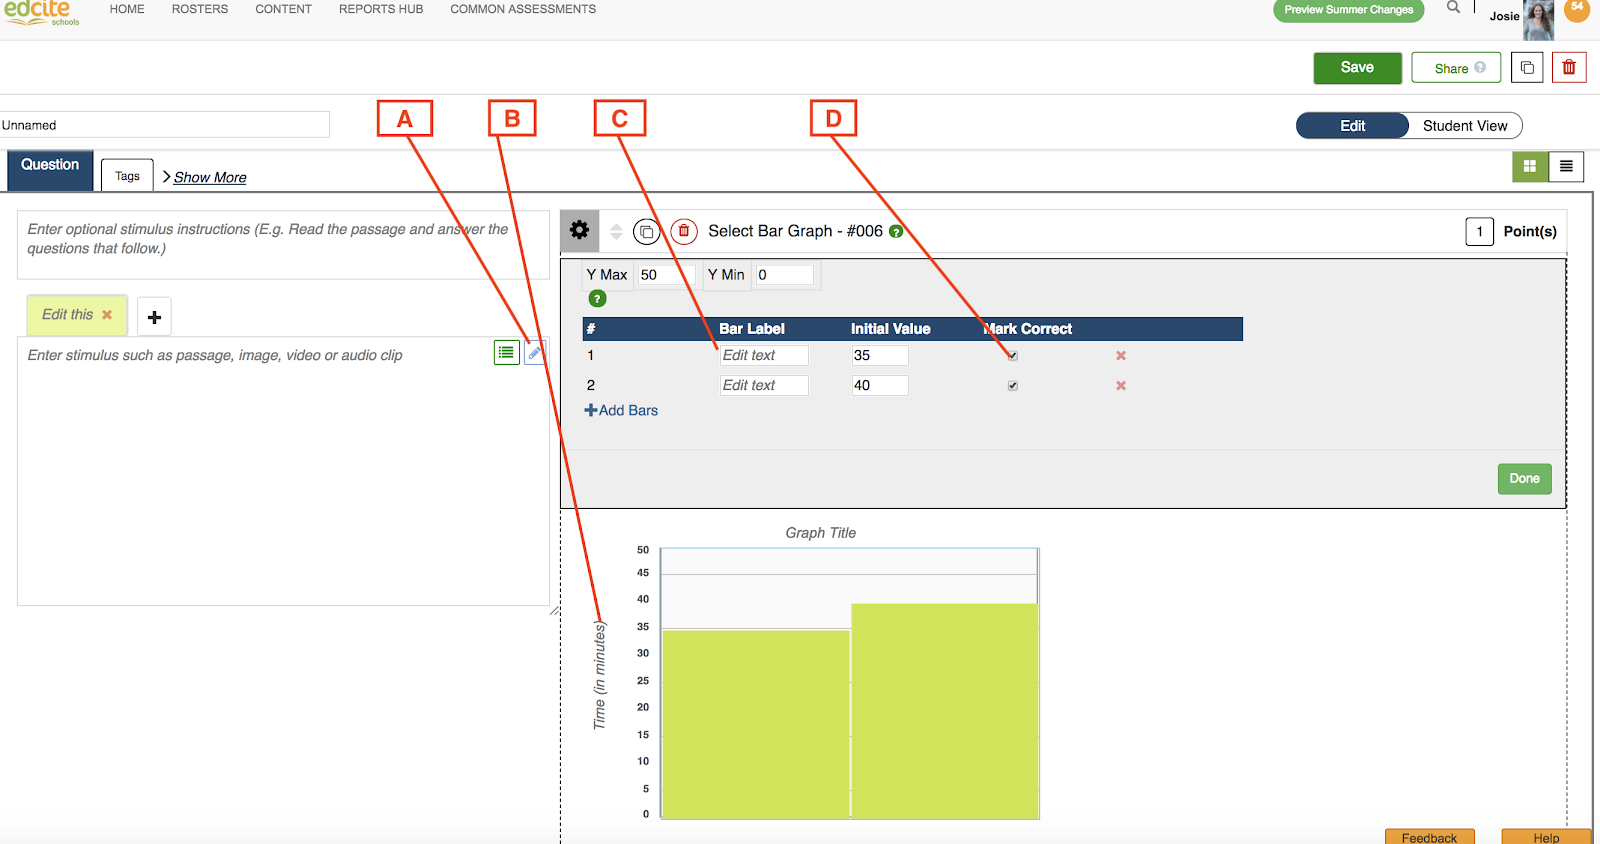
Authoring Functionality | Follow these instructions to set up your question:
|
Scoring | ☑Auto-graded |
Setting the Correct Answer | D. Setting the Answer - Check the box beside the correct bar. |
For more help with this or any other topic on Edcite, please email hello@edcite.com.
The following is the link fo the Google document with this solution:
https://docs.google.com/document/d/198vzQ_AoQU6tKP2m9oRcN1WWBaL3MDpAWaaFtxFxj3k/edit?usp=sharing
ENG02-004
Updated 2 Aug 2018